Overplotting Halo Annotations
The yt_astro_analysis package includes a function that allows one
to overplot the locations of halos from a halo catalog on top of yt
slices and projections. See Plot Modifications: Overplotting Contours, Velocities, Particles, and More for more information on
the other available plot modifications.
To add the halo annotation to the set of available plot modifications, the following line must be added to your script.
import yt.extensions.astro_analysis.halo_analysis
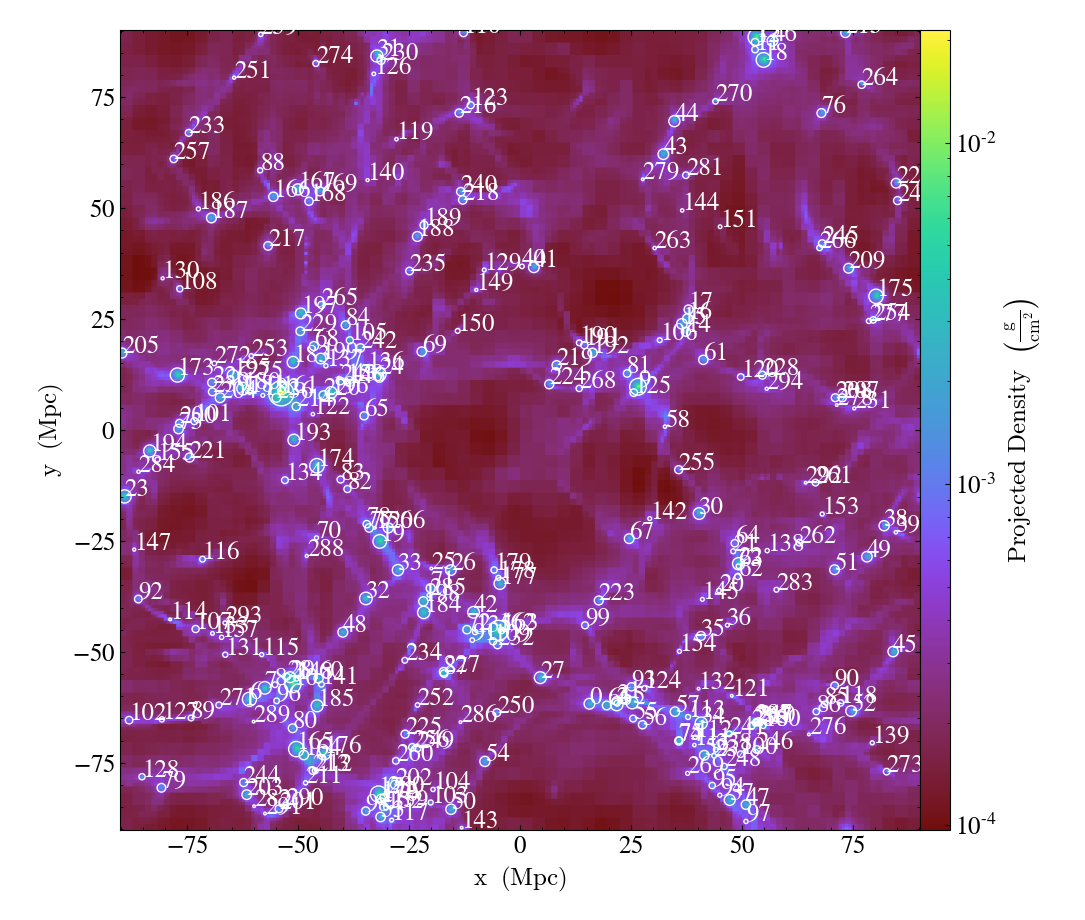
- annotate_halos(self, halo_catalog, circle_args=None, width=None, annotate_field=None, radius_field='virial_radius', center_field_prefix='particle_position', text_args=None, factor=1.0)
This is a proxy for
HaloCatalogCallback.This will overplot circles denoting halo locations. The radius of the circle is given by the “virial_radius” field, but can be changed using the
radius_fieldkeyword argument. The user must provide one of the following:a loaded
ytDatasetof a halo catalog (e.g., a Rockstar catalog).a
YTDataContainerfrom a halo catalog dataset.
import yt
import yt.extensions.astro_analysis.halo_analysis

data_ds = yt.load("Enzo_64/RD0006/RedshiftOutput0006")
halos_ds = yt.load("rockstar_halos/halos_0.0.bin")

p = yt.ProjectionPlot(data_ds, "z", ("gas", "density"))
p.annotate_halos(halos_ds, annotate_field="particle_identifier")
p.save()